Companies making data-driven decisions are 5% more productive and 6% more profitable than their competitors. Unfortunately, most businesses are still struggling with data silos.
For one such North American client, our web development company built a custom business tracker, ensuring field agents get real-time access to pertinent compliance information. Built with modern full-stack development, it centralizes data, adds custom filters, and gives field teams real-time visibility.
This blog walks you through key aspects to create customized dashboard, highlighting the relevance of full-stack solutions for businesses. Do you need a custom dashboard for your business? Hire full-stack developers today and start your journey.
Key Features of Customized Dashboards
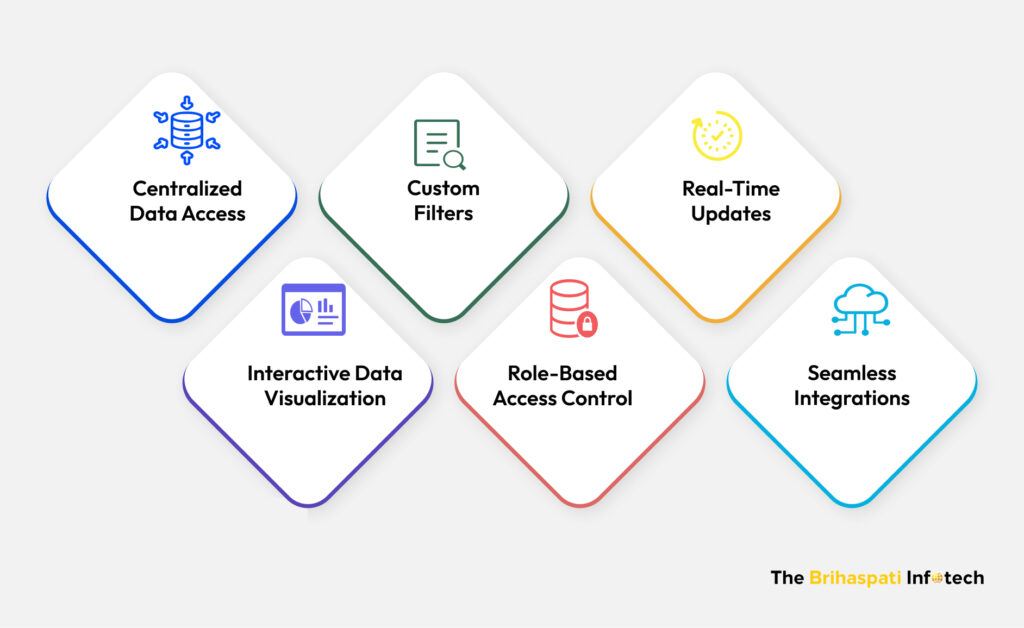
- Centralized Data Access
- All critical information is pulled from multiple sources (databases, spreadsheets, third-party apps) into one dashboard, giving users a single source of truth.
- Custom Filters and Views
- Customized dashboard enables users to filter data by region, product type, or compliance category — ensuring agents get relevant data insights.
- Real-Time Updates
- Integrated with services like Firebase, the dashboard updates instantly when data changes. Equip your team with live information instead of outdated reports.
- Interactive Data Visualization
- With tools like Mapbox, data isn’t just numbers — it’s shown on maps, charts, and graphs that highlight relevant information across different geographies.
- Role-Based Access Control
- Different team members (agents and admins) see only what they need, keeping sensitive data secure while improving usability.
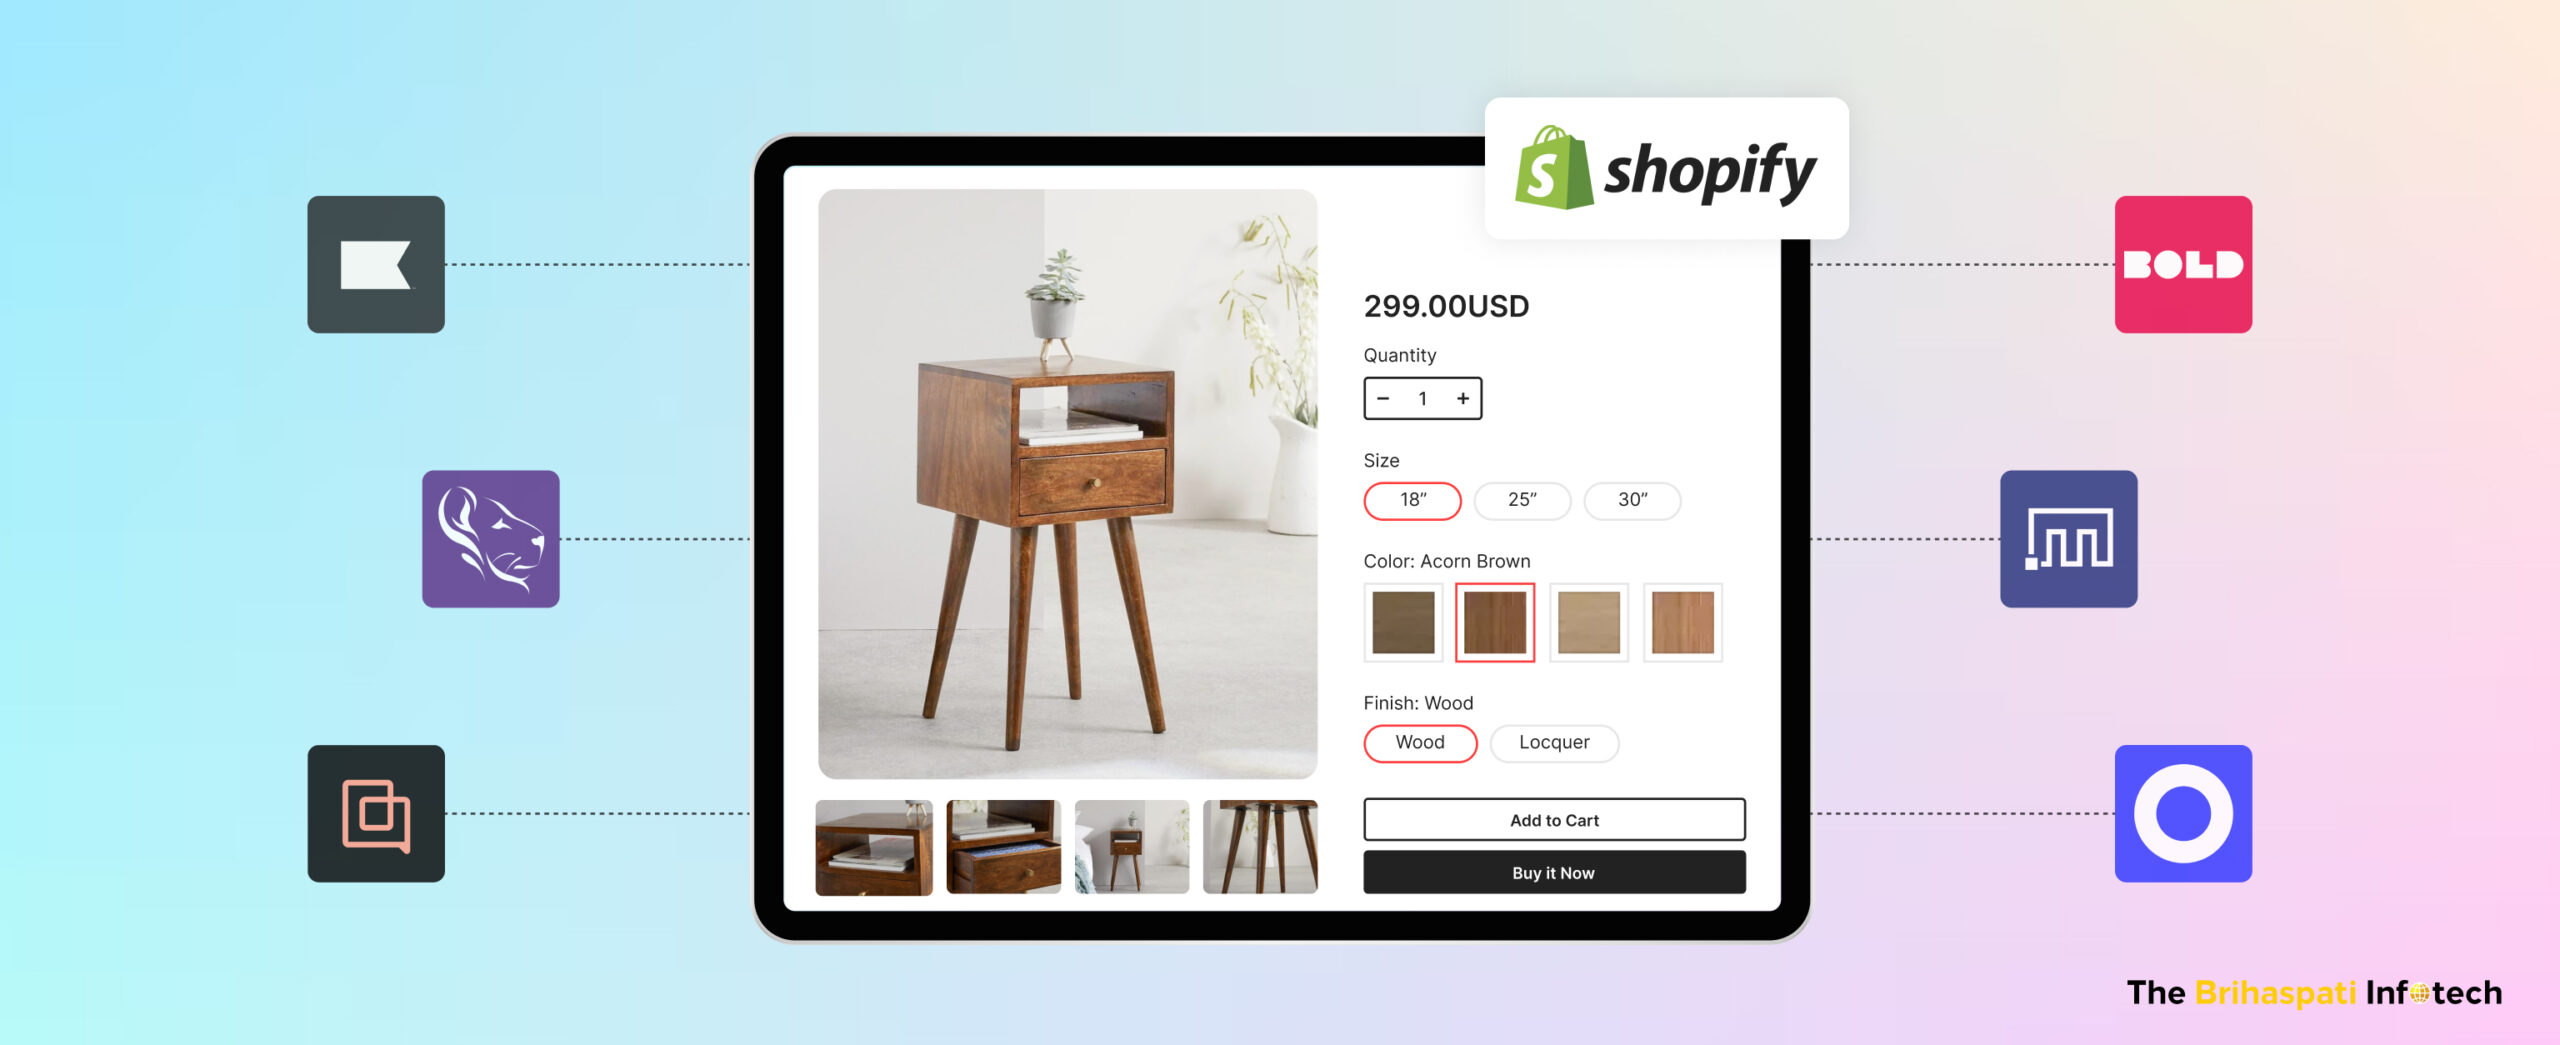
- Seamless Integrations
- Custom dashboards connect with CRMs, ERPs, or workflow tools like Airtable to eliminate silos and make sure all business units operate from the same real-time data.
We can create customized dashboard with unique features, driving meaningful value for your business.
Create Customized Dashboard in 9 Steps: Our Case Study
At The Brihaspati Infotech, we designed and developed a full-stack compliance dashboard tailored for field agents across North America. Let’s walk you through main steps to create customized dashboard using full-stack technology.
Step 1: Determine Project’s Challenges
When we first engaged with the client, their biggest pain point was managing regulatory compliance data across multiple U.S. states. Field agents had to depend on disconnected spreadsheets, PDFs, and email updates, making compliance tracking slow and error-prone.
Key challenges included:
- Scattered compliance data → Every state had different regulations for sustainable packaging, but information was siloed and hard to access.
- Zero real-time visibility → Neither agents nor admins could instantly see whether an installation met local compliance rules.
- Manual errors → Because tracking was done manually, mistakes were common, leading to unreliable reporting.
- Sales inefficiency → Agents often entered client meetings without updated compliance insights, weakening sales conversations.
We proposed a unified full-stack dashboard that brought compliance data, real-time updates, and geolocation mapping into one system.
Step 2: Choosing Right Tech Stack for Dashboard
Our full-stack developers recommended different tools and technologies for the business solution.
- React.js (Frontend): For building an interactive, responsive dashboard that worked seamlessly on web and mobile.
- Node.js with Express (Backend): To handle data processing, validations, and API integrations.
- Airtable (Database): A structured yet flexible hub for managing compliance datasets.
- Firebase (Real-Time Engine): For authentication, real-time updates, and secure role-based access.
- Mapbox (Visualization): To turn compliance data into geographic insights via interactive maps.
Why this stack? It gave us speed-to-market, flexibility to scale, and the ability to build role-based dashboards tailored to both admins and agents.
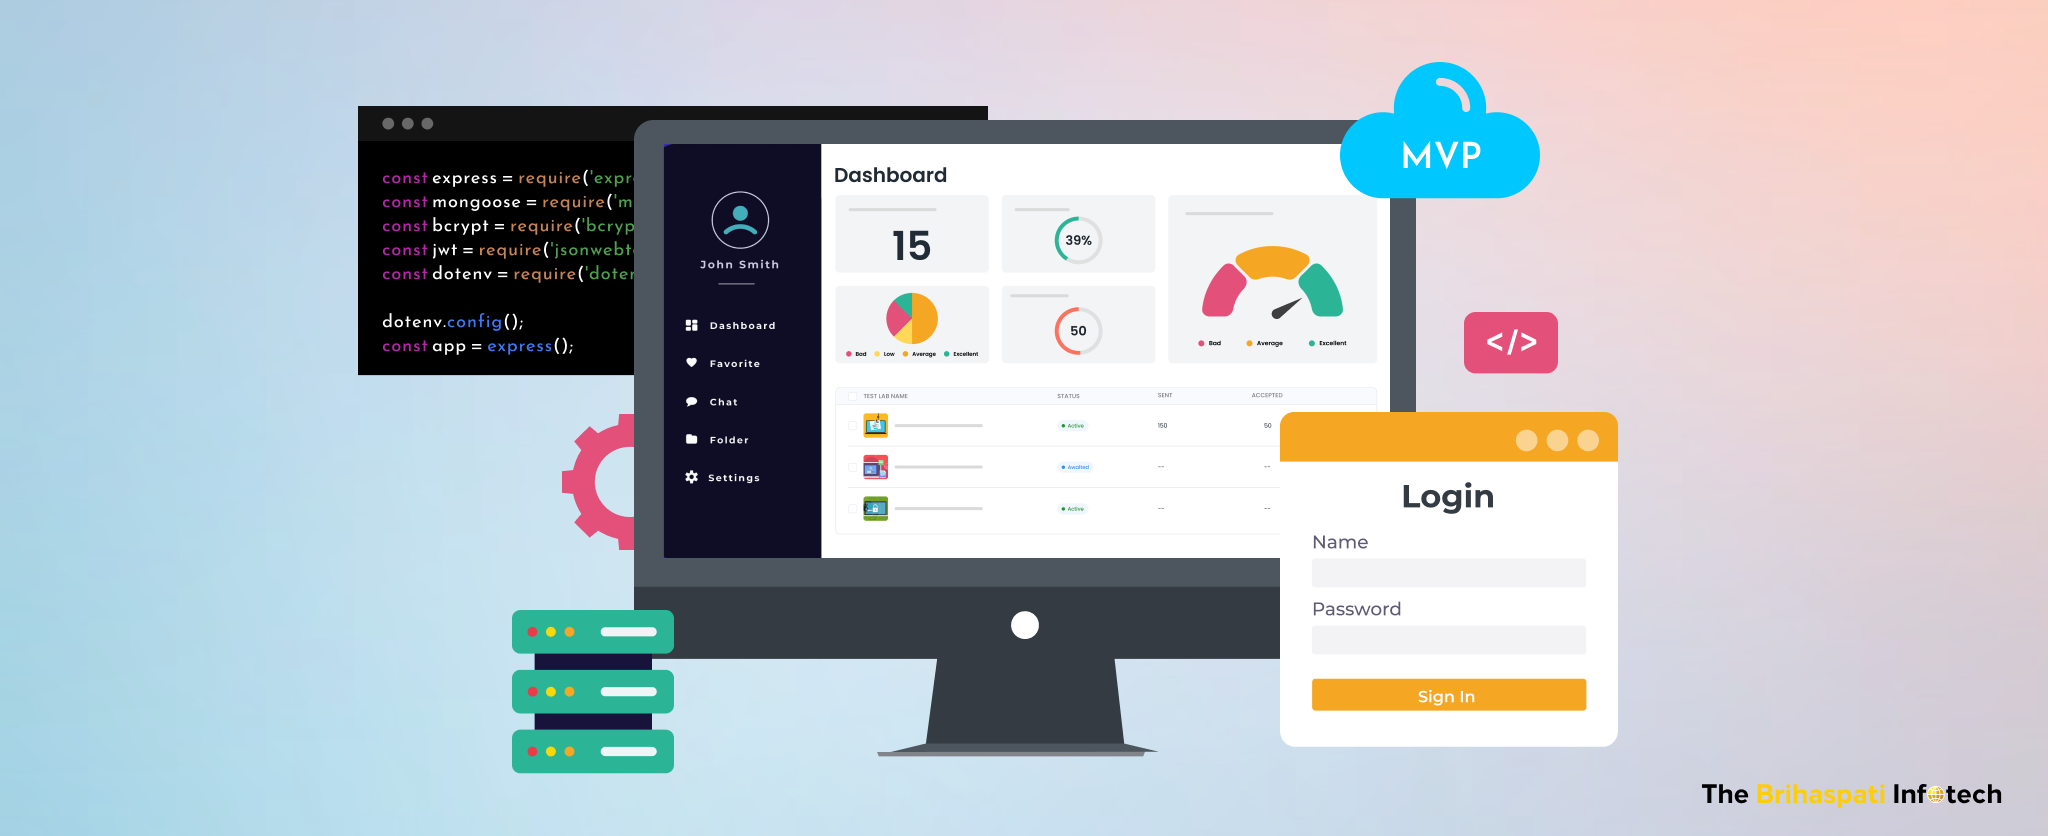
Step 3: Frontend Development with React.js
Our React.JS developers focused on building a clean, intuitive interface that served two different user groups:
- Agents → Could quickly access compliance information via filters (region, law type, product material). No manual entry — only real-time access to what mattered for sales discussions.
- Admins → Gained a powerful dashboard view with interactive maps, advanced filters, and reporting tools to monitor compliance across regions.
We used React’s component-based architecture to design reusable modules like:
- A filter panel to refine compliance data.
- Interactive map overlays powered by Mapbox.
- Auto-updating data tables synced with Firebase.
With React, the dashboard achieved a fluid, intuitive user experience that worked equally well on desktops, tablets, and mobile devices.
Step 4: Backend Development with Node.js & Express
Our Node.js developers ensured seamless data flow between the frontend, Airtable, Firebase, and Mapbox.
- API Development: We created a set of secure REST APIs that connected React with Airtable, Firebase, and Mapbox. These APIs handled tasks like:
- Adding and retrieving compliance records.
- Filtering data based on region or material type.
- Syncing updates with Firebase for real-time use.
- Adding and retrieving compliance records.
- Data Validation Rules:
Every record submitted was validated on the backend before being saved into Airtable. This included checks like:
- Ensuring product IDs were correct.
- Confirming the state’s compliance rules matched the product category.
- Ensuring product IDs were correct.
- Authentication & Security:
Firebase login was integrated with backend logic to enforce role-based access. Agents could only view data; admins could add or manage it.
The backend ensured the accuracy, security, and integrity of compliance data while keeping it available in real time.
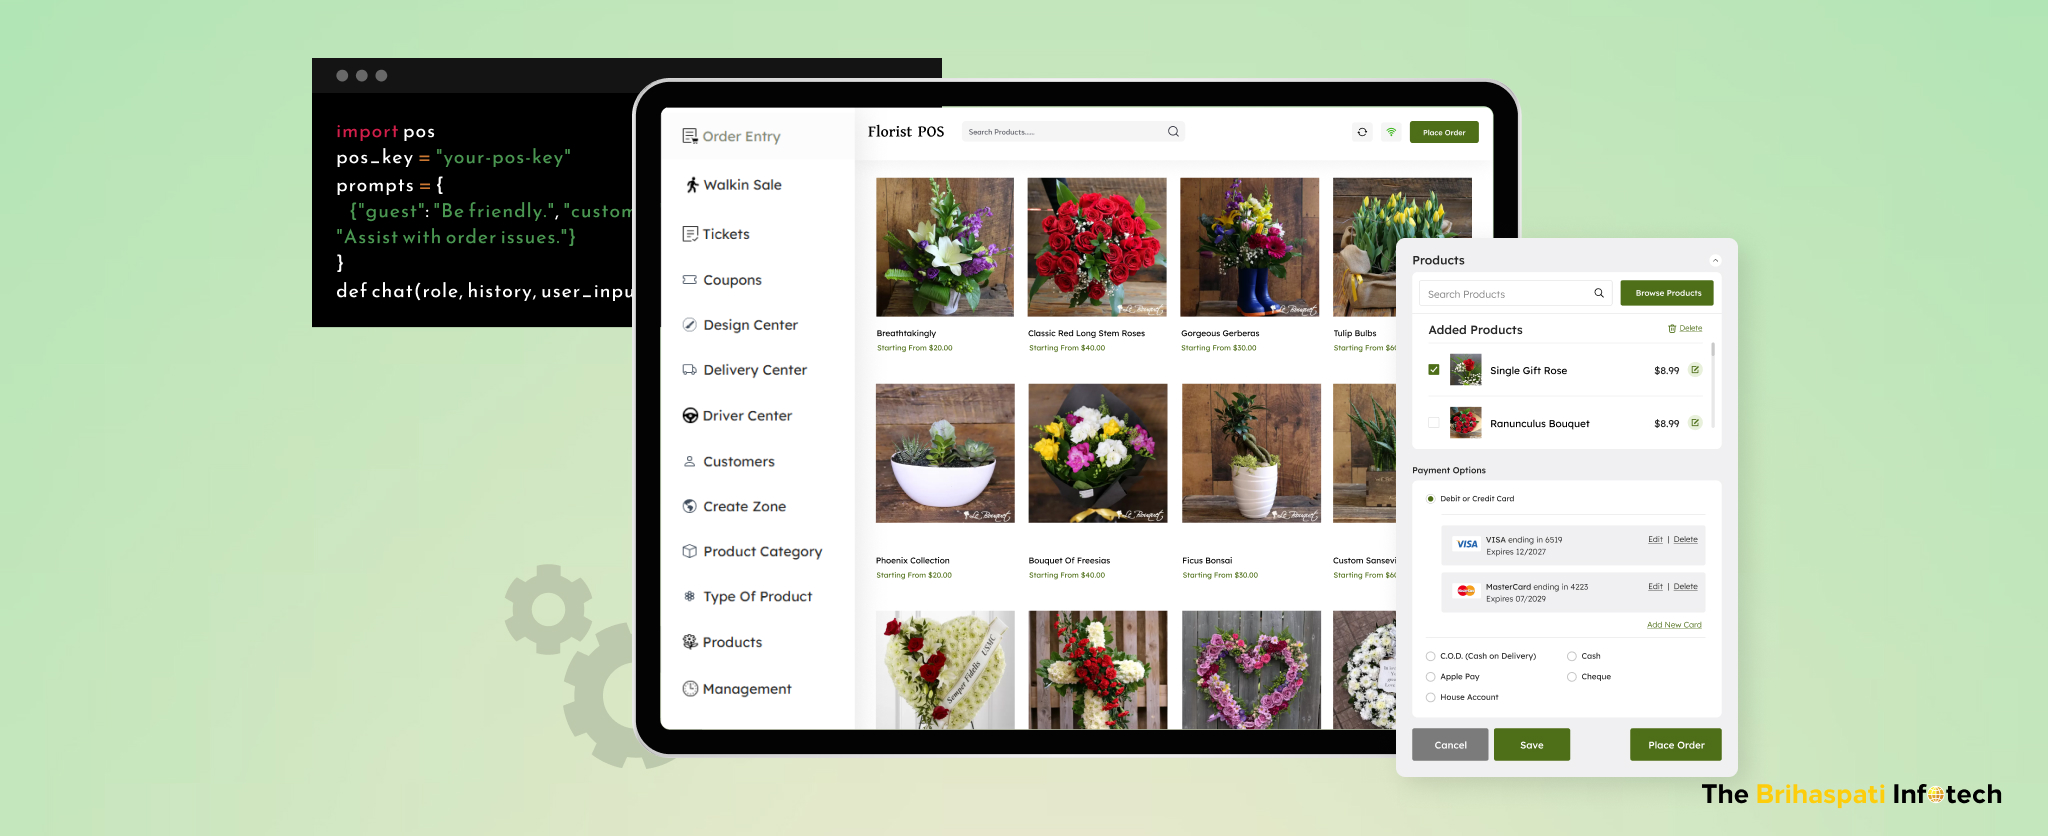
Step 5: Create Customized Dashboard with Multiple Integrations
The real strength of the dashboard came from tight integration between tools. Our API integration solution ensures seamless workflow, driving valuable website interaction.
- Airtable → Became the compliance hub. Admins could manage rules and datasets without needing technical expertise. APIs ensured data was always in sync with the dashboard.
- Firebase → Delivered instant updates and secure access. If admins updated new or edited new information, agents saw it in real time without refreshing.
- Mapbox → Transformed raw compliance data into geographic insights. For example:
- An agent could zoom into Texas and see what packaging products were allowed or restricted.
- An admin could filter installations across the Midwest and spot gaps in compliance coverage.
- An agent could zoom into Texas and see what packaging products were allowed or restricted.
These integrations turned the dashboard from a simple tracker into a decision-making tool for both sales and compliance teams.
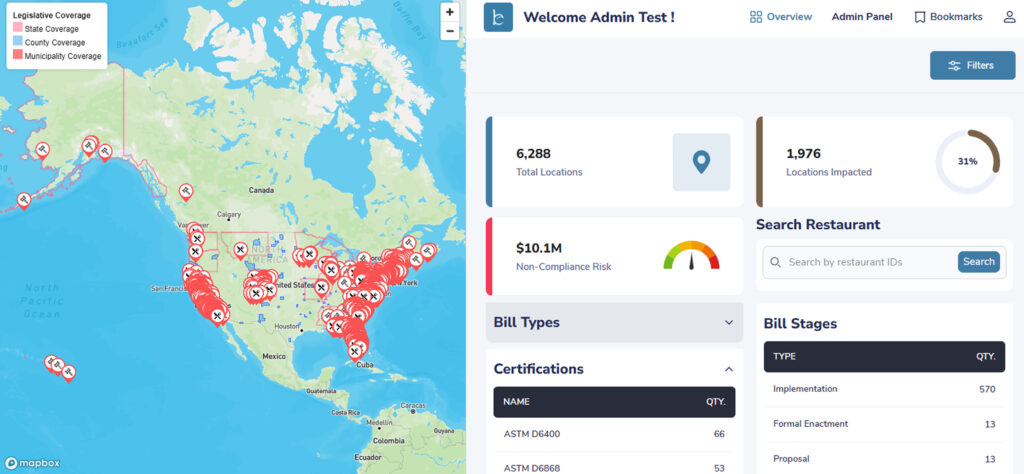
Step 6: Key Features Delivered
The final customized dashboard was packed with features tailored to the client’s needs:
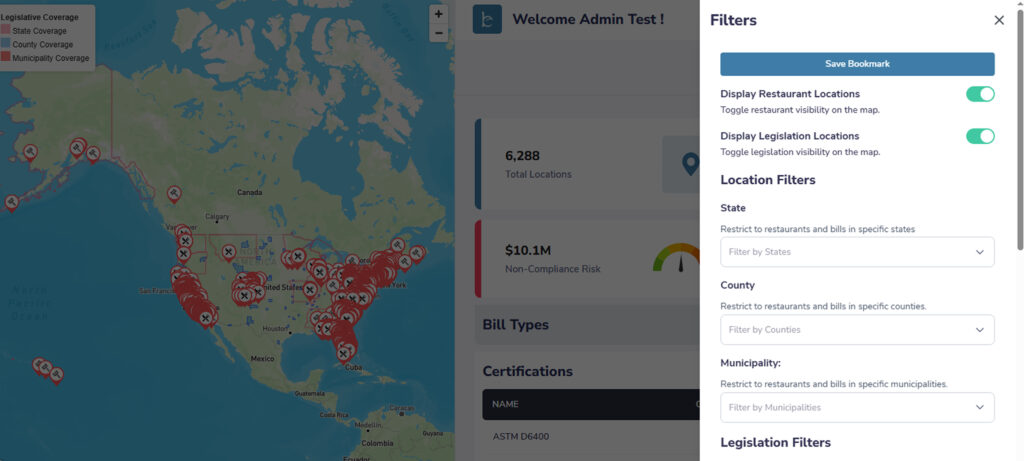
- Interactive Compliance Map: A visual-first approach that replaced static spreadsheets with actionable insights.
- Custom Filters: Drill down by region, product material, or law type to quickly find relevant compliance information.
- Real-Time Updates: Agents and admins always worked with the latest data, thanks to Firebase.
- Role-Based Access Control: Agents and admins had different levels of access, improving both security and workflow.
- Error-Free Submissions: Automated backend validation minimized human errors and boosted data reliability.
Instead of wasting hours on manual reporting, agents could access compliance info instantly, and admins had full visibility across regions.
Step 7: Testing & Quality Assurance
We ran extensive testing to ensure the dashboard was reliable and scalable:
- Unit testing for React components and backend APIs.
- Cross-device testing to ensure the dashboard worked smoothly on desktops, tablets, and mobile devices.
- Load testing to confirm Firebase + Airtable could handle multiple agents submitting data simultaneously.
The system was stable, fast, and ready for real-world use.
Step 8: Deployment & Hosting
The customized dashboard was deployed on a scalable cloud infrastructure (e.g., AWS/Azure/Google Cloud depending on client preference).
- CI/CD pipelines were set up for smooth updates.
- Secure HTTPS and role-based authentication were enforced.
Step 9: Post-Launch Support & Iteration
After launch, we provided ongoing support and improvements:
- Monitored Firebase and Airtable performance.
- Collected user feedback from agents in the field.
- Added small enhancements like new filters and reporting formats.
The dashboard evolved into a long-term compliance tracking solution, scaling with the client’s growing dataset and expanding team.
Business Results with Customized Dashboard
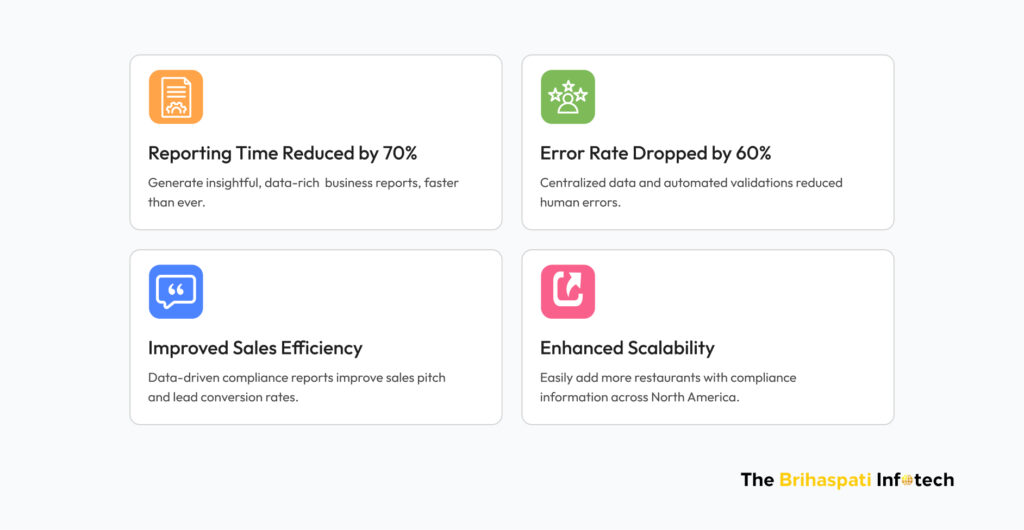
Within weeks of launch, the customized dashboard transformed the client’s compliance tracking workflow:
- Reporting time reduced by 70% → What once took days of manual spreadsheet checks now happened in real time.
- Error rate dropped by 60% → Automated validations and centralized data minimized human mistakes.
- Improved sales efficiency→ Agents walked into meetings with updated compliance insights, enabling stronger pitches and faster deal closures.
- Scalability secured → As regulations expanded across states, the dashboard scaled effortlessly without adding manual workload.
Our unified, intelligent dashboard continues to deliver clarity, speed, and confidence for both agents and admins.
Key Challenges Resolved to Create Customized Dashboard
1. Breaking Down Data Silos and Complex Integrations
The client’s compliance data was stored in multiple spreadsheets and manual reports. Agents had no single place to view accurate and updated information.
Our Solution:
Our developers integrated Airtable, Firebase, and Node.js APIs to create a centralized compliance database. Airtable became the structured data source, while Firebase synced updates in real time. This broke down silos, ensured consistency across users, and gave both admins and agents a reliable single source of truth.
2. Ensuring High Performance & Scalability
With hundreds of compliance records across multiple U.S. states, the dashboard needed to scale without slowing down. Heavy geolocation data from Mapbox and real-time access by multiple agents made performance a critical concern.
Our Solution:
We built a modular backend with Node.js, optimized Airtable queries, and used Firebase for lightweight real-time syncing. On the frontend, React.js components were separated for faster rendering, and caching reduced redundant calls. This architecture ensured the dashboard stayed responsive even as compliance data grew.
3. Delivering Intuitive User Experience (UX)
Field agents needed a simple way to access and filter compliance data, while admins required deeper visibility with maps and reports. If the UX was clunky, adoption would drop.
Our Solution:
We built a role-based React.js interface:
- Agents had a clean, mobile-friendly dashboard to quickly filter compliance info by region, product type, or regulation.
- Admins had a powerful view with Mapbox maps, custom filters, and reporting tools for oversight.
By focusing on clarity and accessibility, we ensured both roles got exactly what they needed without clutter.
4. Meeting Security and Compliance Standards
Because the dashboard handled sensitive regulatory data, it was crucial to ensure secure access and prevent unauthorized use.
Our Solution:
We implemented Firebase authentication with role-based access control. Agents could securely view compliance data, while only admins could add, update, or manage records. All sensitive data was encrypted, and backend validation via Node.js ensured integrity at every step.
Frequently Asked Questions
Yes. Custom dashboards can connect with:
1. CRM platforms (like Salesforce, HubSpot) to sync customer data.
2. ERP tools (like SAP, Oracle) to align product and compliance records.
3. Internal systems (like Airtable or spreadsheets) for importing historical compliance data.
This ensures agents see real-time compliance intelligence without switching tools.
Mapbox transforms a wall of regulatory text into an interactive map, letting agents filter and visualize compliance laws by state, province, or city. Instead of reading through 50+ documents, agents can instantly see where a product is compliant and where restrictions apply.
Full-stack web development helps you build tracker tailored to your exact workflow. Unlike generic BI tools, they provide:
1. A role-based interface for agents and admins.
2. Backend logic that automates compliance checks and real-time updates.
3. Easy integration with tools like Airtable, Firebase, CRM, or ERP systems.
4. Scalability to handle growing users and data without slowing down.
5. Strong security with role-based access controls.
This means, the business tracker is not only fast and accurate but also flexible enough to evolve with your business.
Generally,
1. Basic dashboards (filters + compliance database) take 6–8 weeks.
2. Advanced dashboards (geo-mapping, real-time sync, multiple user roles) take 3–4 months.
Schedule a strategy call.
The cost depends on project complexity such as custom features, integrations, and data scale.
A lightweight version (basic filters + Airtable integration) can fit your low budget. However, a full-stack web solution involving geo-visualization, real-time sync, and CRM/ERP integrations requires a larger investment.
customized dashboard isn’t a one-time tool — it grows with your business. After launch, you can add:
1. New compliance rules as regulations change
2. Additional agents or regions without rebuilding the system
3. Custom features like advanced reporting or mobile access
Most importantly, our team provides ongoing support and iteration, ensuring the dashboard evolves with your business needs.
Ready to Create Customized Dashboards?
Our customized dashboard helped the US client empower their field agents with real-time compliance insights. With faster responses, happier customers, and stronger business growth, the client not only improved operational efficiency but also achieved measurable financial gains.
At The Brihaspati Infotech, we build full-stack web solutions tailored to business-specific needs, from custom dashboards and SaaS apps to B2B eCommerce platforms. If you’re ready to turn complex data into actionable insights, let’s build your custom dashboard solution today.
Stay Tuned for Latest Updates
Fill out the form to subscribe to our newsletter